> ## Documentation Index
> Fetch the complete documentation index at: https://help.aichat.com/llms.txt
> Use this file to discover all available pages before exploring further.
# Dashboard Overview & Analytics
> Dashboard Overview & Analytics shows an overview of chatbot performance, user interactions, and customer feedback. This guide helps you navigate and interpret essential metrics to successfully optimize the operation of your chatbot.
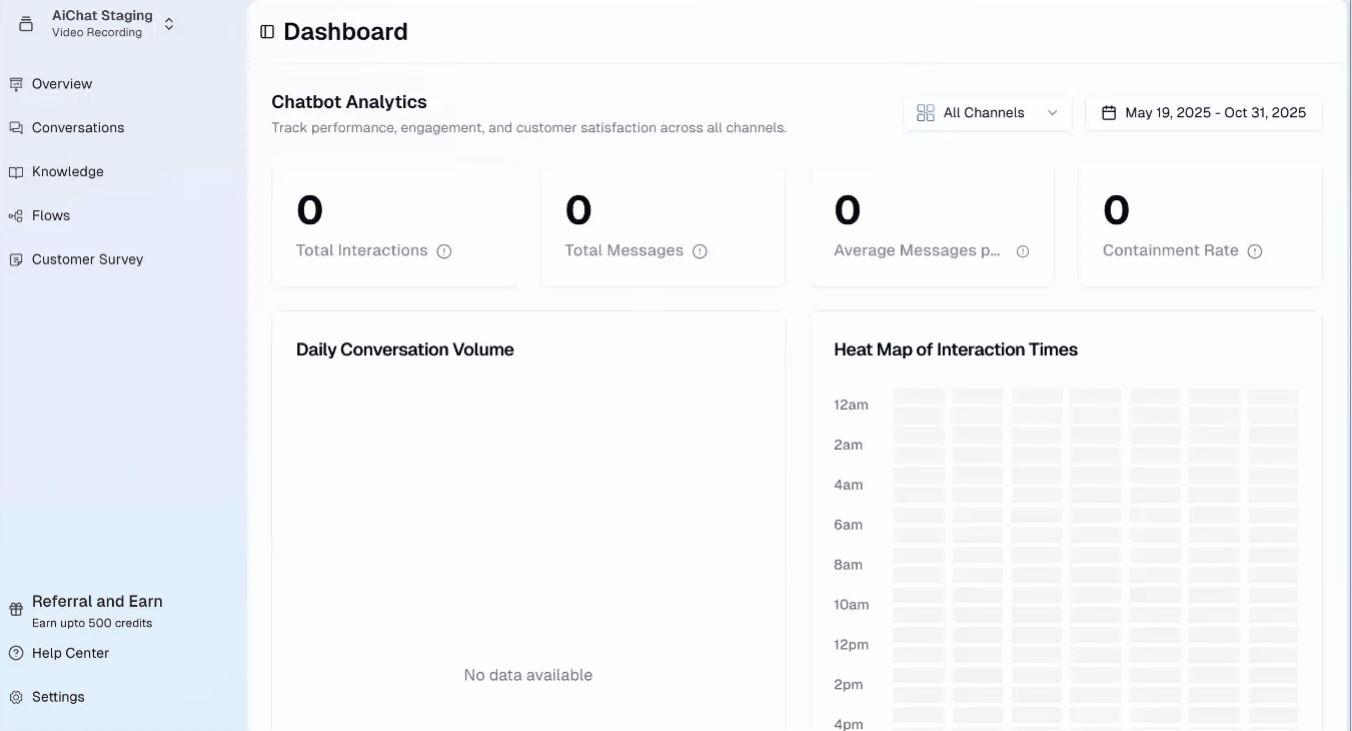
## 1. Chatbot Analytics: Viewing Performance Data
This section focuses on core chatbot performance and interaction volume within a specified time frame.
**Steps to View Data:**
1. **Select Date Range:** Choose a predefined option (e.g., Last 7 Days, This Month) or set a custom range by selecting start and end dates from the calendar.
2. **Select Channels:** Choose specific channels to narrow down the data you wish to view.
3. **Apply:** Click the **Apply** button to update the dashboard with your selections.
 ## **3 Key Metrics to Monitor:**
* **Total Interactions:** The total number of conversations handled by the chatbot during the selected period.
* **Total Messages:** The total number of messages sent and received, which indicates how engaging the chatbot is. This can be viewed daily or monthly.
* **Average Messages per Chat:** A measure of the average length of a conversation, indicating chat depth.
## **3 Key Metrics to Monitor:**
* **Total Interactions:** The total number of conversations handled by the chatbot during the selected period.
* **Total Messages:** The total number of messages sent and received, which indicates how engaging the chatbot is. This can be viewed daily or monthly.
* **Average Messages per Chat:** A measure of the average length of a conversation, indicating chat depth.
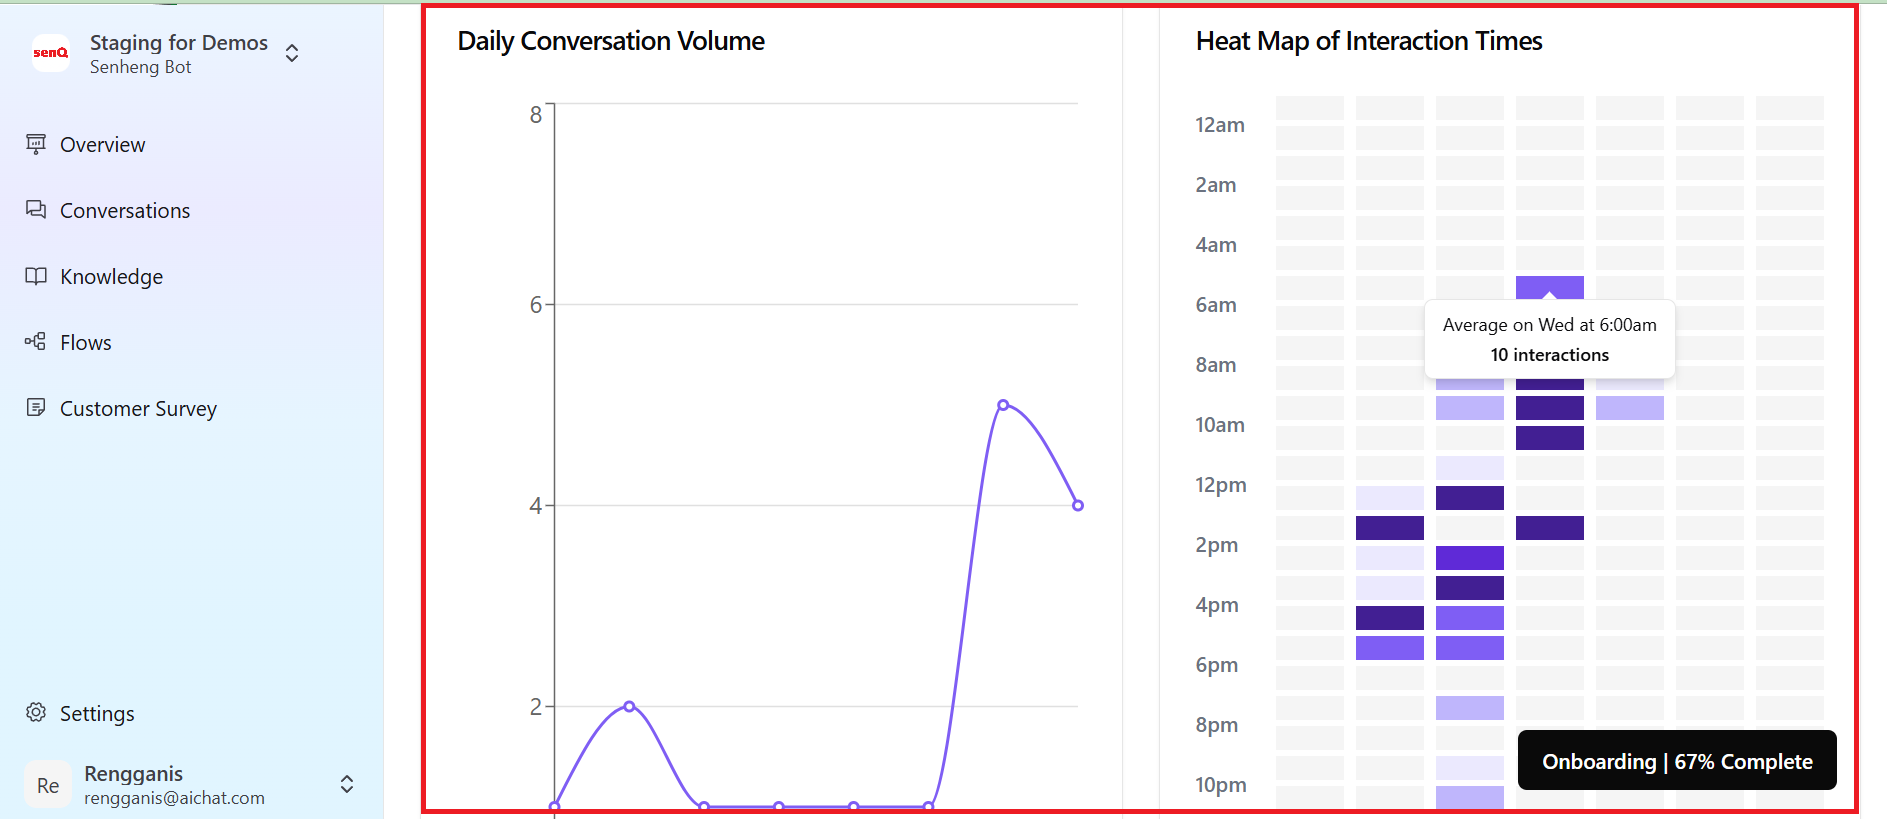
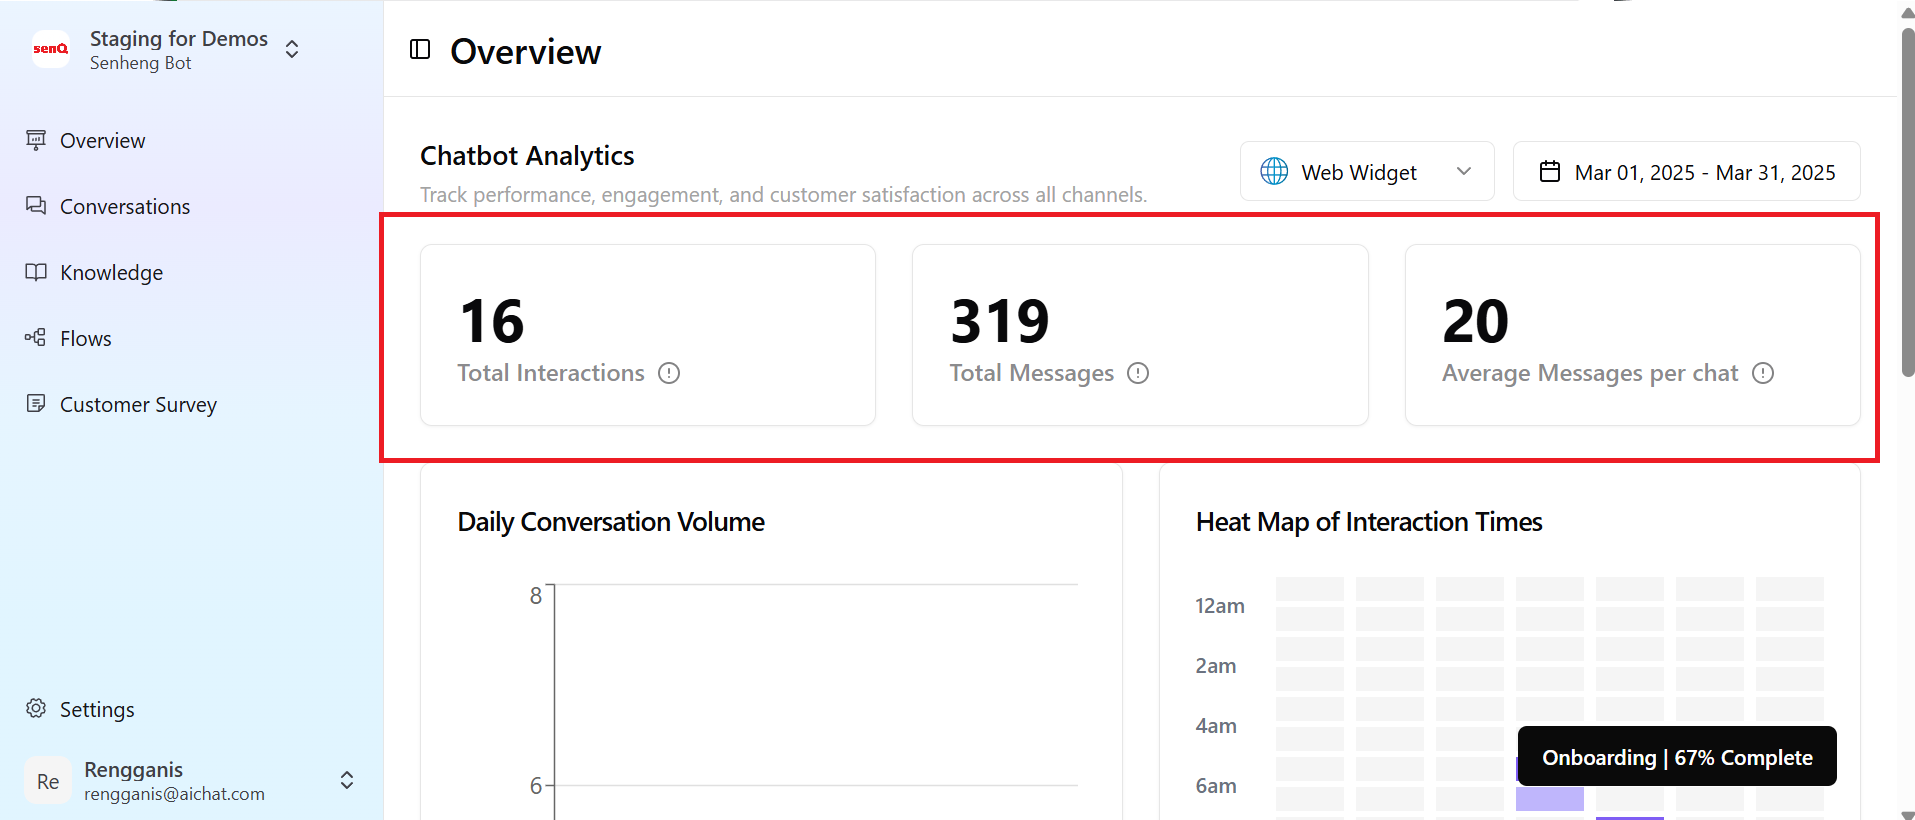 ## 2. Daily Conversation Volume & Heat Map
This visual section helps you identify peak usage times.
* **Heat Map of Interaction Times:** Shows what the busiest hours of your chatbot are.
* **Daily Conversation Volume:** A line chart that displays the number of interactions on a daily basis.
## 2. Daily Conversation Volume & Heat Map
This visual section helps you identify peak usage times.
* **Heat Map of Interaction Times:** Shows what the busiest hours of your chatbot are.
* **Daily Conversation Volume:** A line chart that displays the number of interactions on a daily basis.
 ## Customer Survey Analytics
This section gives an insight into customers and their satisfaction.
## Customer Survey Analytics
This section gives an insight into customers and their satisfaction.
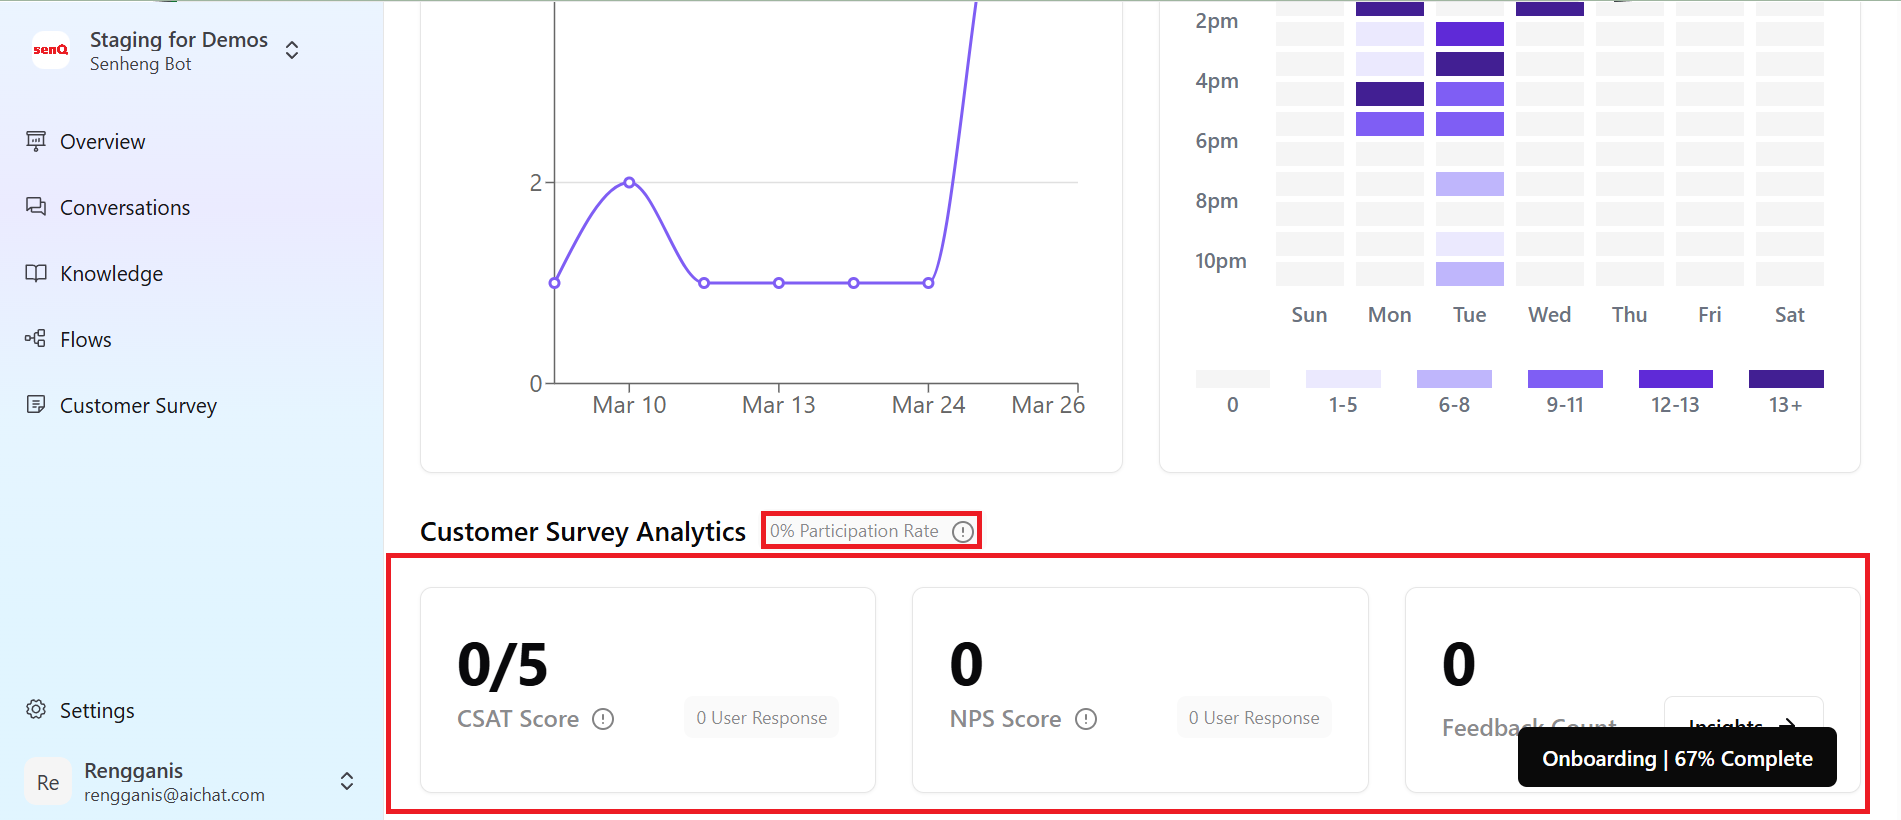 **Key Metrics to Monitor:**
* **CSAT Score (Customer Satisfaction Score):** Measures user contentment with chatbot responses on a satisfaction scale of 1 to 5. The score is calculated as the total cumulative ratings divided by the total number of responses.
* **NPS Score (Net Promoter Score):** Indicates customer loyalty. A positive number closer to 100 is ideal. The score is calculated as the difference between the total percentage of users giving a thumbs-up (👍) minus the total percentage of users giving a thumbs-down (👎).
* **User Survey Feedback Count:** The total number of user responses received through the surveys.
* **Rate of Participation:** The percentage of users who interacted with the chatbot and subsequently provided feedback.
## Best Practices for Dashboard Monitoring
Do a weekly or monthly review schedule to monitor trends in the dashboard.
Compare historical data to identify long-term patterns and improvement areas.
Adjust chatbot responses, workflows, and escalation rules based on data insights.
Monitor analytics to determine if adjustments boost engagement and satisfaction.
**Key Metrics to Monitor:**
* **CSAT Score (Customer Satisfaction Score):** Measures user contentment with chatbot responses on a satisfaction scale of 1 to 5. The score is calculated as the total cumulative ratings divided by the total number of responses.
* **NPS Score (Net Promoter Score):** Indicates customer loyalty. A positive number closer to 100 is ideal. The score is calculated as the difference between the total percentage of users giving a thumbs-up (👍) minus the total percentage of users giving a thumbs-down (👎).
* **User Survey Feedback Count:** The total number of user responses received through the surveys.
* **Rate of Participation:** The percentage of users who interacted with the chatbot and subsequently provided feedback.
## Best Practices for Dashboard Monitoring
Do a weekly or monthly review schedule to monitor trends in the dashboard.
Compare historical data to identify long-term patterns and improvement areas.
Adjust chatbot responses, workflows, and escalation rules based on data insights.
Monitor analytics to determine if adjustments boost engagement and satisfaction.